Welch PSD and Amplitude Spectrum
Estimate Welch power spectral densities or amplitude spectra for all displayed state components while preserving the physical frequency axis.
Question and result
Calculation performed
Estimate and compare the frequency content of all displayed state components using either Welch power spectral densities or amplitude spectra.
GUI tab
GUI tab
Espectro
Configuration and calculation
Control sequence
- Generate a compatible trajectory or configure the system directly in Espectro. The tab analyzes and plots every displayed state component as its declared observation set.
- Set the transient, integration step, total duration, and frequency limits before choosing the spectral output.
- Use PSD de Welch (recomendado) for an averaged power-per-frequency estimate or Espectro de amplitud for Fourier-component magnitude. Keep the corresponding label and units with each result.
- Generate the graph and repeat with a longer retained window or smaller dt to check whether the main features persist.
Record
Computed data
- A frequency axis consistent with the trajectory sampling step and one Welch PSD or amplitude curve for each displayed state component.
- Readable dominant peaks, harmonics, or broadband regions within the requested frequency limits.
Scientific reading
Interpretation criteria
Sharp peaks can support a periodic interpretation, whereas broader content can accompany irregular motion; compare the component curves because each coordinate can emphasize different frequencies.
Spectral content is supporting numerical evidence and must be interpreted with trajectories, transient checks, and other diagnostics.
Files
Experiment record
- Save the graph after confirming the mode, units, component labels, and frequency limits shown in the figure.
- Record the system, parameters, initial state, integration method, dt, total time, discarded transient, reused-trajectory state, spectral mode, displayed components, and frequency window.
Applications
Questions addressed by the calculation
- Comparing dominant frequencies across parameters, state components, or numerical settings.
- Characterizing periodic, quasiperiodic-looking, and irregular signals before deeper analysis.
- Preparing reproducible spectral figures for teaching and numerical research reports.
Scope
Evidence conditions
- Finite windows limit frequency resolution, while a large dt can alias high-frequency content.
- Welch PSD and amplitude spectrum are different quantities. Compare them by preserving their definitions and units.
- A peak pattern or broadband spectrum supports a frequency-domain observation. Establish chaos, attraction, or hiddenness through the corresponding additional evidence.
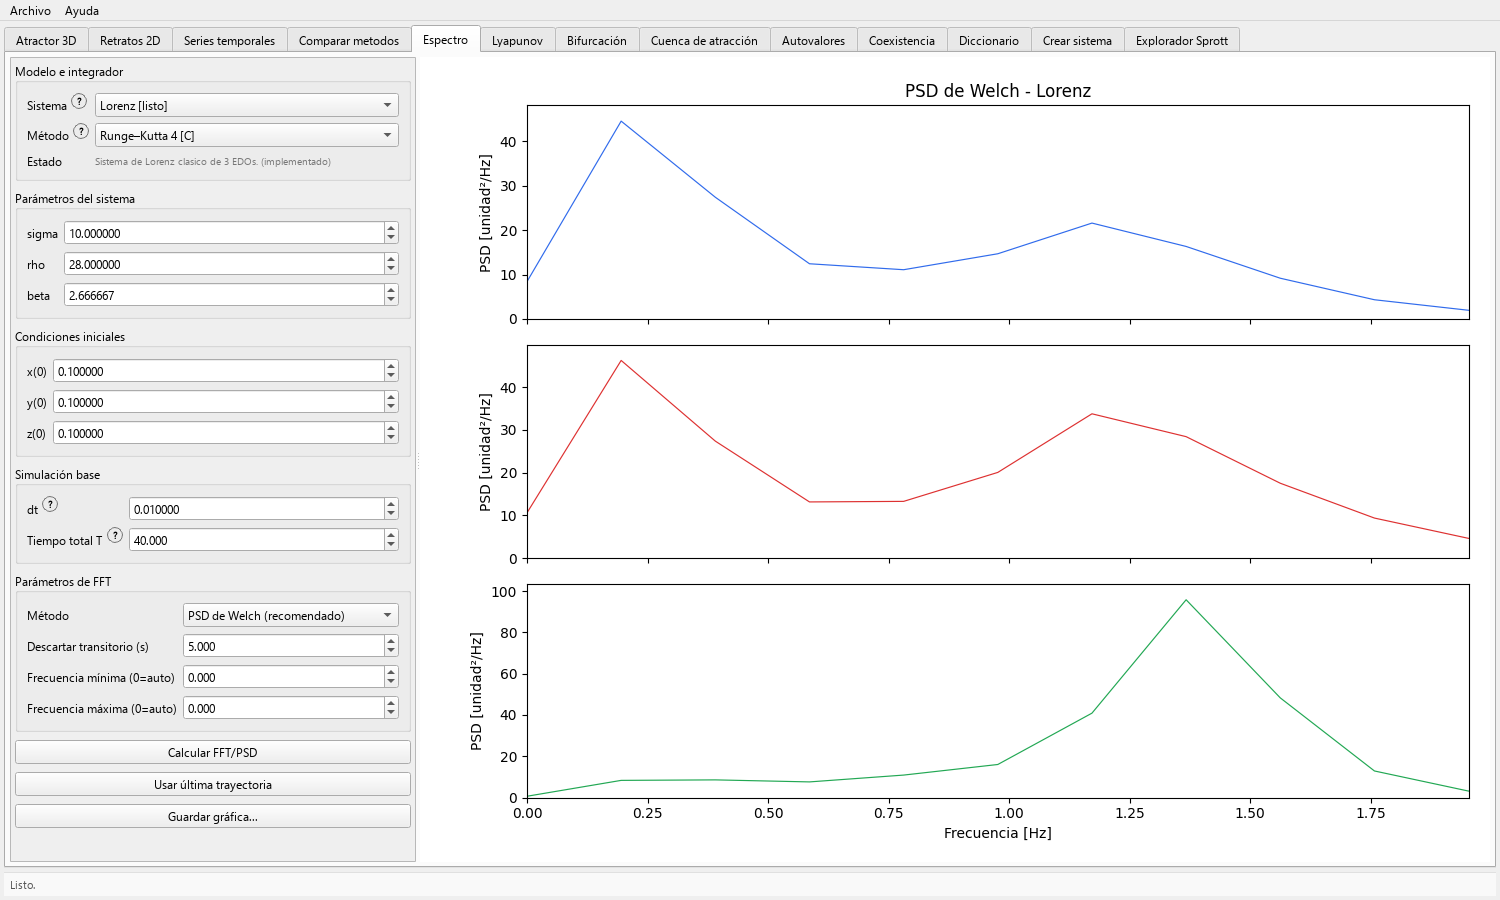
Spectral-analysis procedure
- Generate a trajectory in Atractor 3D, then open Espectro and select Usar última trayectoria; alternatively, configure the same system directly in this tab.
- Set a transient long enough to retain the settled motion. The tab calculates and plots all displayed state components together as its observation set.
- Select PSD de Welch (recomendado) when comparing distributed power, or Espectro de amplitud when the magnitude of discrete frequency components is the quantity of interest.
- Confirm that
dtand total duration support the frequency range and resolution required by the study. - Generate the graph, inspect peaks and broadband regions, then repeat with a longer window or smaller step to assess numerical sensitivity.
- Save the figure only after recording the system, parameter values, initial state, integration method,
dt, total time, transient, displayed components, and spectral mode.
Welch PSD and amplitude spectrum
Spectral analysis converts a sampled time-domain signal into frequency content. Periodic trajectories commonly display sharp peaks at a fundamental frequency and its harmonics, while irregular trajectories may distribute power over broader bands.
Toolbox Chaos offers two distinct outputs. The Welch power spectral density averages overlapping windowed segments to reduce the variance of the estimate; the amplitude spectrum reports Fourier-component magnitude. Preserve the respective physical quantity and label for each output. The tab draws a curve for every displayed coordinate because each one observes a different projection of the orbit.
A spectrum is a comparison and characterization tool. Broadband energy can support an interpretation of irregular motion when trajectories, transients, step-size sensitivity, bifurcation structure, and convergence-aware Lyapunov diagnostics accompany it.
Window, transient, and frequency controls
- Sampling step:
dtcontrols the highest frequency represented before aliasing enters the sampled signal. - Total time: longer windows improve frequency resolution; short windows blur peaks.
- Transient removal: startup behavior can leak energy across frequencies and hide the final regime.
- Displayed components: compare the x, y, and z curves because they can emphasize different frequencies for the same trajectory.
- Spectral mode: a Welch PSD measures power per unit frequency, whereas an amplitude spectrum measures Fourier-component magnitude.
- Frequency range: zooming too far out can compress useful structure near low frequencies.