Álgebra, algoritmo y práctica reproducible
Explorador Sprott
Manual técnico y práctico para decodificar las familias del Explorador Sprott, construir sus ecuaciones, integrar flujos, interpretar filtros rápidos y exportar ejecuciones reproducibles.
Pregunta y resultado
Cálculo que realizará
Pasar de un código compacto a ecuaciones explícitas, una trayectoria numérica y un paquete de datos que pueda volver a ejecutarse con el mismo contrato.
Pestaña de la interfaz
Pestaña de la interfaz
Explorador Sprott
Configuración y cálculo
Secuencia de controles
- Normalice el código a mayúsculas y retire espacios, guiones y guiones bajos; conserve el primer carácter como clave de familia.
- Compruebe la longitud exigida, transforme cada carácter restante mediante la regla ASCII y distribuya los coeficientes según el orden de monomios documentado.
- Distinga mapa de flujo. Para un mapa, itere la función; para un flujo, el selector actual permite Euler o RK4. Indique h, N y el horizonte T=Nh.
- Simule desde x0=(0.1,…,0.1), descarte el transitorio y lea el estado del filtro antes de interpretar la proyección.
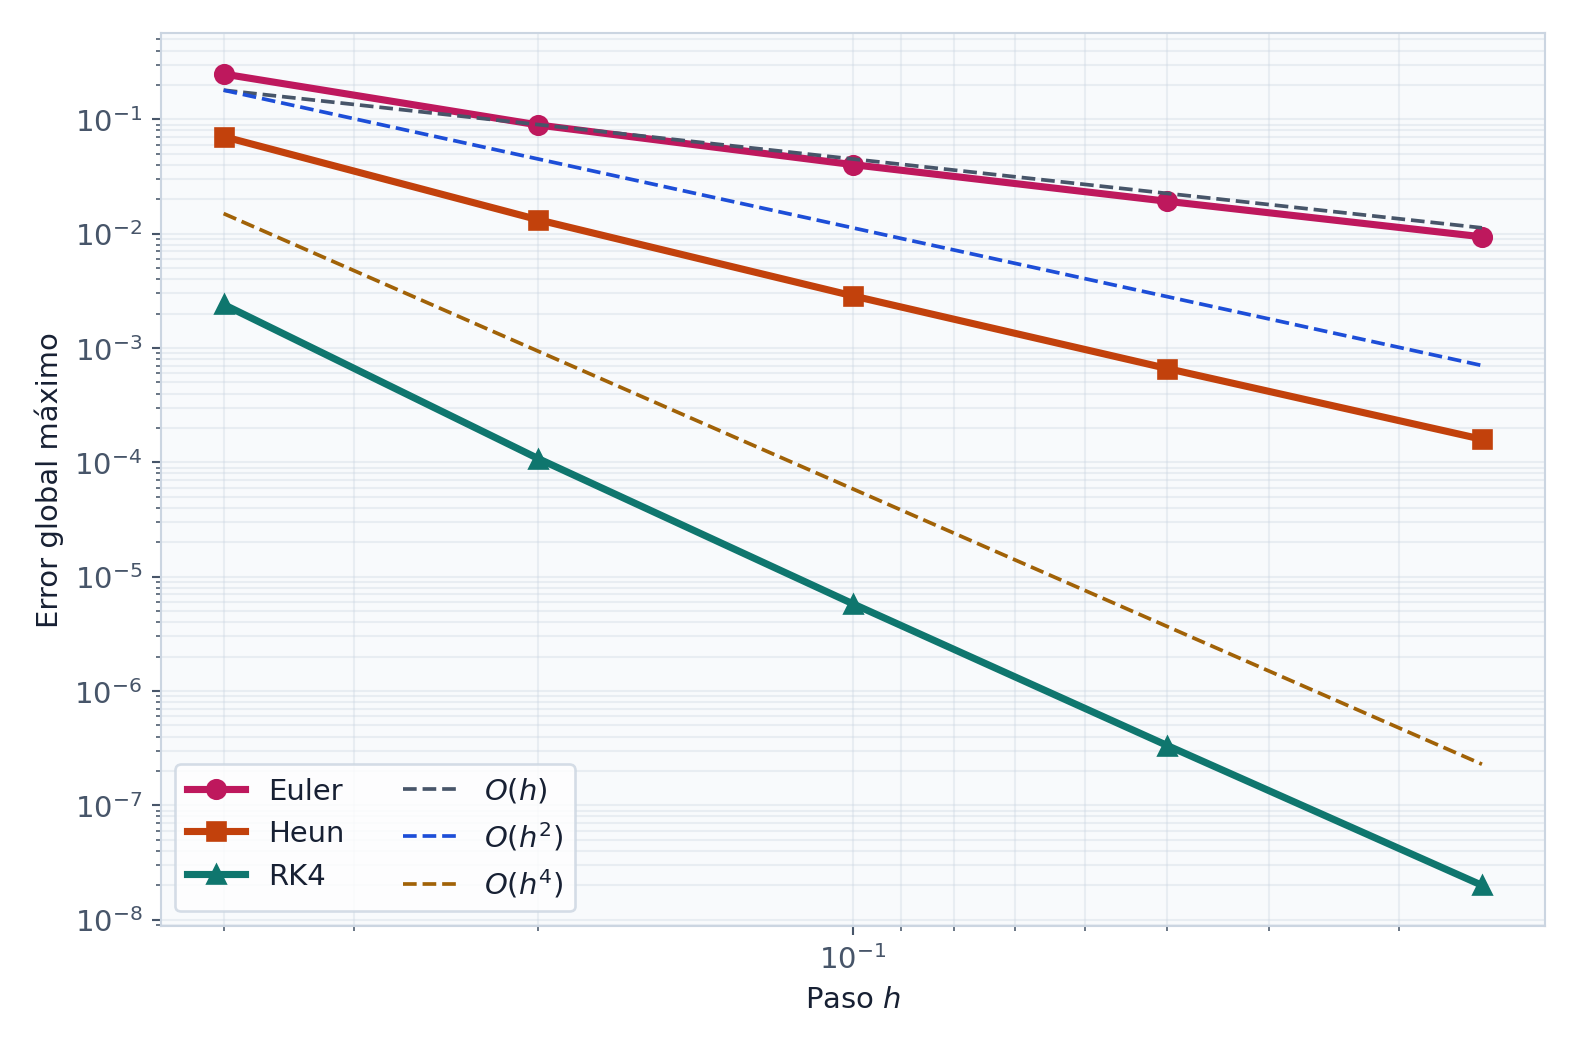
- Repita los flujos con h/2 y el doble de pasos para conservar T. Guarde JSON, CSV, figura y notas de comparación.
Registro
Datos obtenidos
- Una familia validada, su dimensión y grado, el vector de coeficientes, la base monomial y las ecuaciones reconstruidas.
- Una trayectoria finita posterior al transitorio, acompañada del método, los umbrales, el estado del filtro y la configuración gráfica.
Lectura científica
Criterios de interpretación
La letra inicial pertenece a la gramática de familias A–X o Y–^. Las letras A–S de la tabla clásica son nombres de sistemas completos y forman un catálogo distinto.
Una figura estructurada es un resultado exploratorio. Su lectura mejora al repetir la simulación, refinar el paso de los flujos y revisar series temporales, rangos y diagnósticos independientes.
Archivos
Registro del experimento
- Exporte la figura, los metadatos JSON, la trayectoria CSV y la explicación Markdown. Use Exportar explicación Markdown para conservar la secuencia de trabajo.
- Registre también Semilla aleatoria, intentos máximos, Max puntos, proyección, color, tamaño, transparencia, bandas, ejes y DPI.
Aplicaciones
Preguntas que admite el cálculo
- Enseñar la relación entre una base polinomial, una matriz de coeficientes y un sistema iterado o diferencial.
- Comparar integradores, pasos, transitorios y proyecciones con registros compactos de convenciones explícitas.
- Construir colecciones locales de ejecuciones con datos, ecuaciones y metadatos verificables.
Alcance
Condiciones de la evidencia
- Los filtros rápidos separan fallas evidentes y comportamientos simples; complete los candidatos con un estudio de convergencia y la prueba matemática pertinente.
- La cuarta coordenada auxiliar de algunas familias especiales actúa como variable de progreso; el tiempo físico se obtiene de la regla temporal declarada.
- El JSON y el CSV actuales se complementan con una bitácora de ejecución para conservar todos los detalles necesarios.
01
Del texto compacto a una función matemática
El decodificador convierte el código a mayúsculas y elimina separadores. El primer carácter determina la clase de objeto; los siguientes se vuelven números. Para un carácter χ se usa la regla
Como ord(M)=77, M representa 0. A produce −1.2 y Y produce 1.2. El alfabeto continúa: Z vale 1.3. La generación aleatoria ordinaria restringe los coeficientes a E–U, es decir, de −0.8 a 0.8, aunque el lector acepta un intervalo mayor.
| Carácter | ASCII | Cálculo | Coeficiente |
|---|---|---|---|
M | 77 | (77−77)/10 | 0.0 |
A | 65 | (65−77)/10 | −1.2 |
Y | 89 | (89−77)/10 | 1.2 |
Para D variables y grado total máximo O, la cantidad de monomios que incluye el término constante es
Así, un mapa cuadrático 4D necesita 15 monomios por ecuación, 60 coeficientes y 61 caracteres contando la clave M. Esta prueba de longitud evita desplazar un coeficiente a la ecuación equivocada.
02
Orden de los monomios y forma matricial
Toolbox Chaos usa grado total creciente y un orden fijo dentro de cada grado. El orden forma parte del formato: cambiarlo conserva los mismos números, pero construye otro sistema.
| Caso | Vector de base en el orden de lectura |
|---|---|
| 1D, grado 2 | |
| 2D, grado 2 | |
| 3D, grado 2 | |
| 4D, grado 2 | |
| Bloque cúbico 2D |
Los coeficientes se acomodan por ecuaciones en una matriz C. Si φ(X) es la columna de monomios, la misma construcción sirve para los dos tipos de dinámica:
03
Tabla completa de claves polinomiales A–X
La columna Clave identifica una familia de gramática. Por ejemplo, Q significa “flujo 3D cuadrático” y requiere 30 coeficientes para completar su definición.
| Clave | Tipo | D | Grado O | Coeficientes | Longitud |
|---|---|---|---|---|---|
A | Mapa | 1 | 2 | 3 | 4 |
B | Mapa | 1 | 3 | 4 | 5 |
C | Mapa | 1 | 4 | 5 | 6 |
D | Mapa | 1 | 5 | 6 | 7 |
E | Mapa | 2 | 2 | 12 | 13 |
F | Mapa | 2 | 3 | 20 | 21 |
G | Mapa | 2 | 4 | 30 | 31 |
H | Mapa | 2 | 5 | 42 | 43 |
I | Mapa | 3 | 2 | 30 | 31 |
J | Mapa | 3 | 3 | 60 | 61 |
K | Mapa | 3 | 4 | 105 | 106 |
L | Mapa | 3 | 5 | 168 | 169 |
M | Mapa | 4 | 2 | 60 | 61 |
N | Mapa | 4 | 3 | 140 | 141 |
O | Mapa | 4 | 4 | 280 | 281 |
P | Mapa | 4 | 5 | 504 | 505 |
Q | Flujo | 3 | 2 | 30 | 31 |
R | Flujo | 3 | 3 | 60 | 61 |
S | Flujo | 3 | 4 | 105 | 106 |
T | Flujo | 3 | 5 | 168 | 169 |
U | Flujo | 4 | 2 | 60 | 61 |
V | Flujo | 4 | 3 | 140 | 141 |
W | Flujo | 4 | 4 | 280 | 281 |
X | Flujo | 4 | 5 | 504 | 505 |
Familias especiales Y–^
Estas claves siguen fórmulas y longitudes propias, distintas de la base polinomial general.
| Clave | Nombre | Nc / L | Regla principal | Observación |
|---|---|---|---|---|
Y | Valor absoluto | 10 / 11 | z registra (x⁺)²+(y⁺)² y w funciona como progreso auxiliar. | |
Z | Lógica AND/OR | 10 / 11 | Puede inspeccionarse como entrada histórica; la trayectoria numérica requiere una familia simulable del explorador. | |
[ | Potencias de valores absolutos | 14 / 15 | z y w conservan información auxiliar. | |
\ | Senos acoplados | 18 / 19 | z y w conservan información auxiliar. | |
] | Rotación y cizalla | 6 / 7 | Si el denominador se acerca a cero, θ se fija en cero y se informa la incidencia; z y w son auxiliares. | |
^ | Oscilador forzado discreto | 9 / 10 | w conserva el progreso auxiliar. |
En las familias con coordenada de progreso, cuando Nmax>1000, y vale cero en caso contrario. Esta variable indica el avance del recorrido; la magnitud física correspondiente debe definirse en el modelo.
04
Mapas, flujos y tres integradores
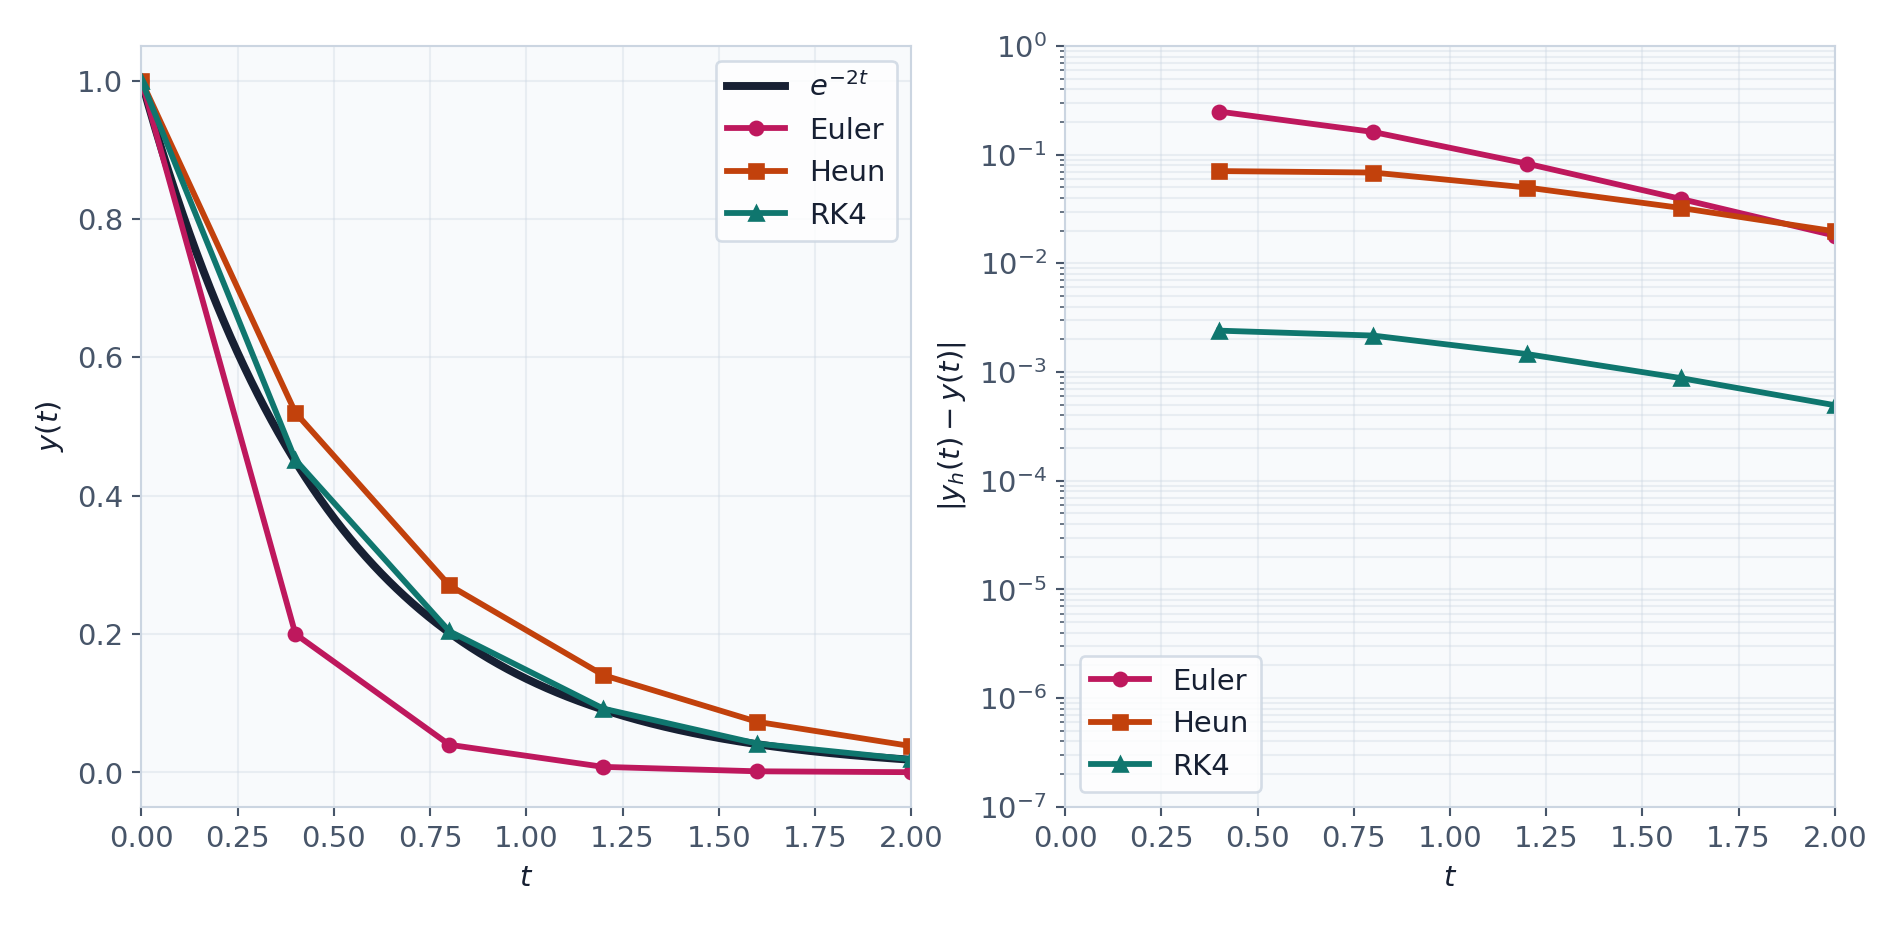
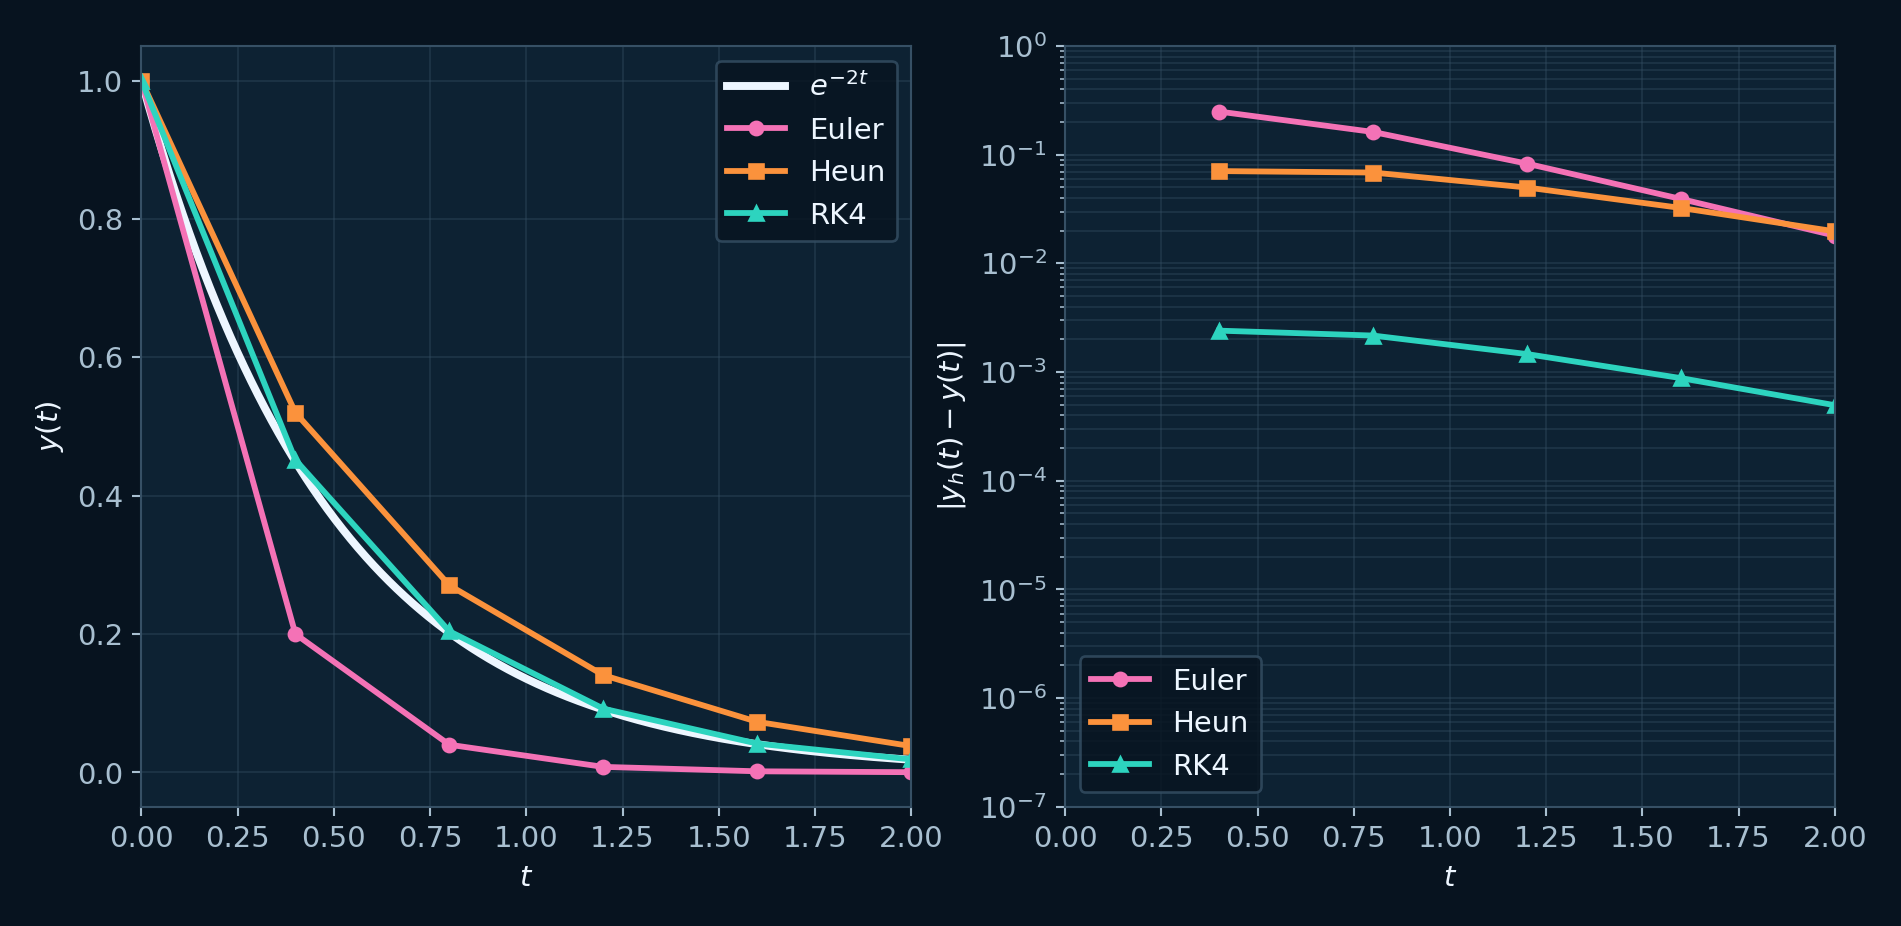
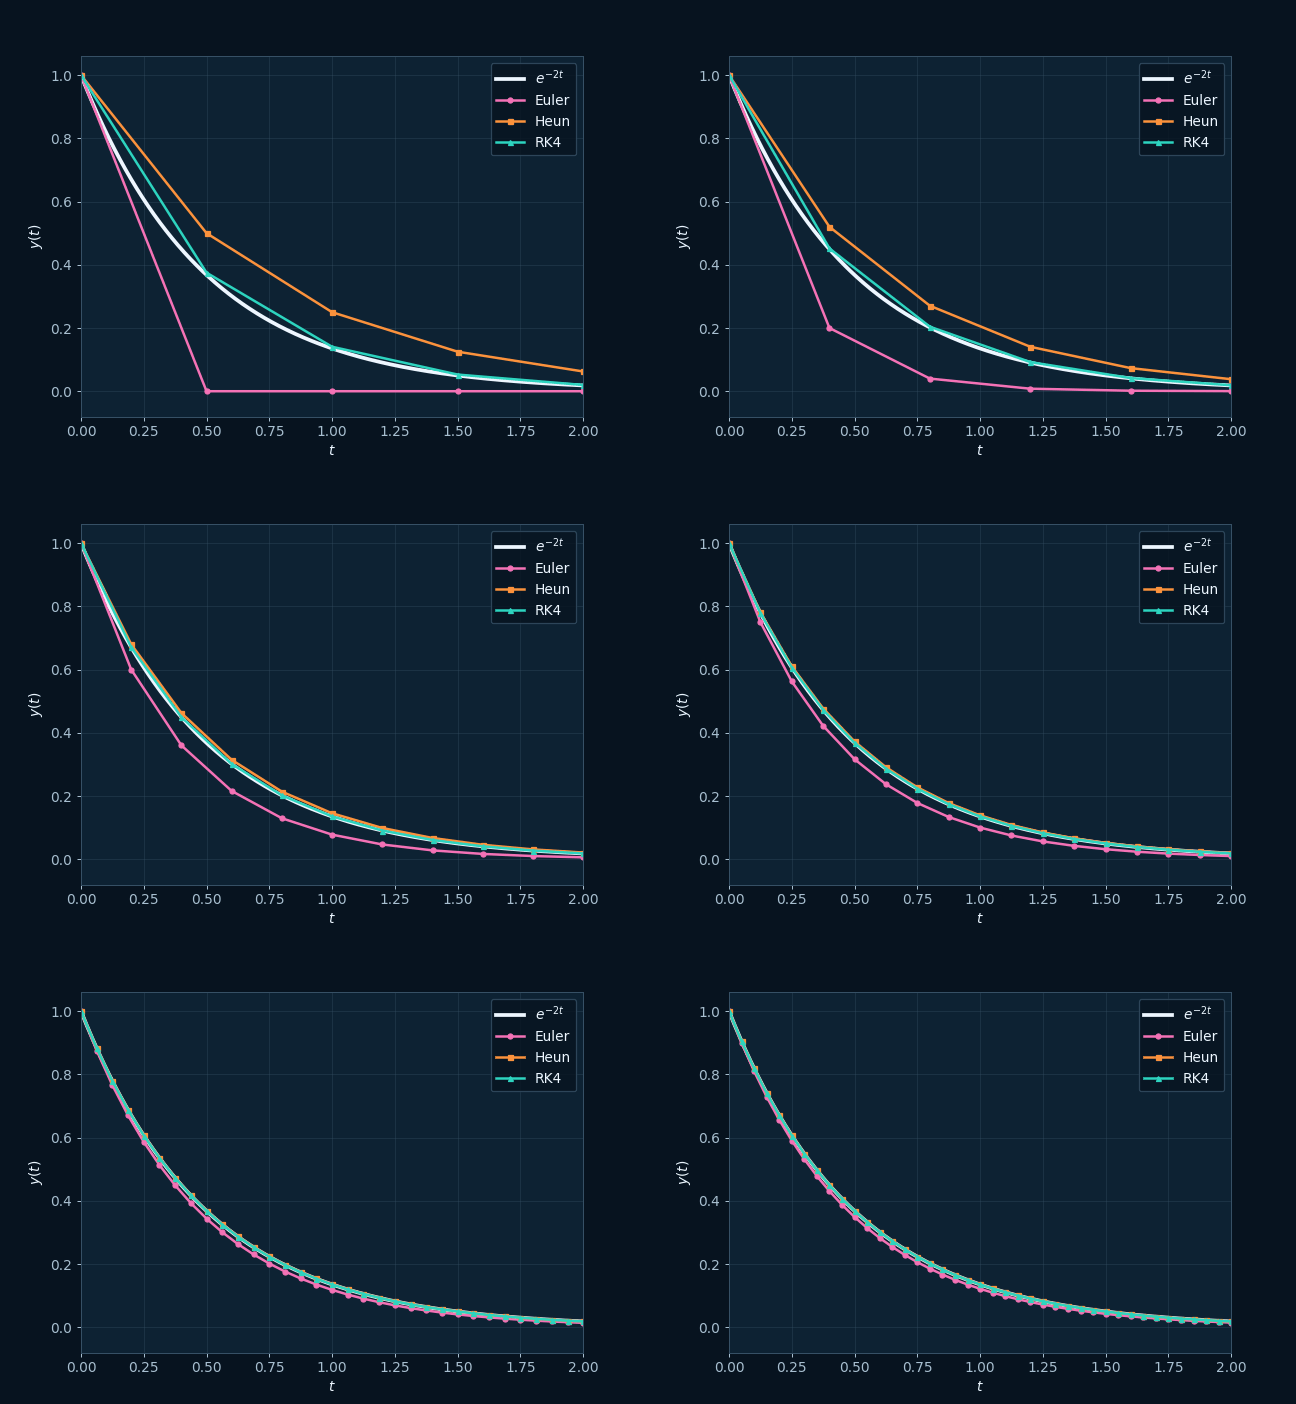
Un mapa aplica directamente Xn+1=F(Xn). Un flujo exige aproximar la solución de una EDO. La comparación correcta mantiene el mismo estado inicial, función, horizonte y transitorio; al pasar de h a h/2 se duplica N para conservar T=Nh.
Euler
Orden: Error local O(h²), global O(h).
Uso: Control rápido y didáctico; sensible a pasos grandes.
Heun / RK2
Orden: Error local O(h³), global O(h²).
Uso: Disponible en el núcleo numérico y sus pruebas; el selector actual del Explorador Sprott cubre las familias expuestas en su interfaz.
RK4
Orden: Error local O(h⁵), global O(h⁴).
Uso: Opción base para flujos cuando se acompaña de refinamiento en h.
05
Filtros rápidos y estimación de Lyapunov
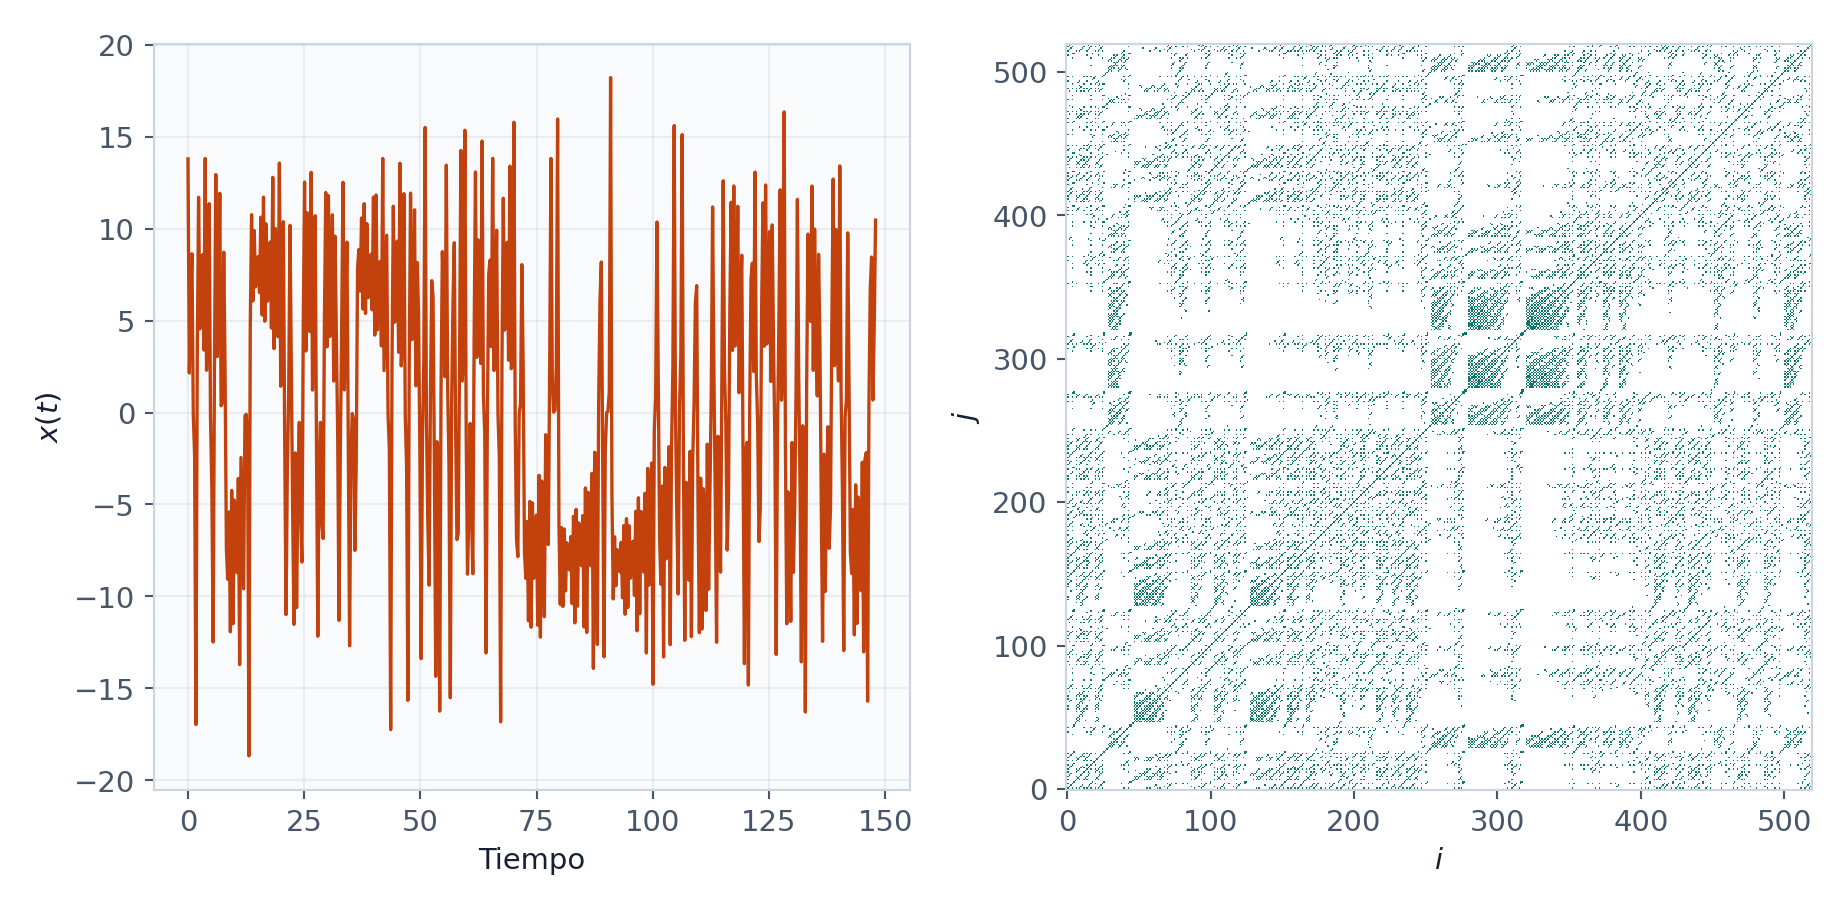
Después de retirar el transitorio, el explorador aplica reglas económicas en un orden definido. Un tramo vacío devuelve estado indeterminado. Un valor no finito o una norma máxima mayor o igual que Rdiv detiene la ejecución como divergente. Luego se buscan coincidencias con el último estado y variación muy pequeña.
- Punto fijo: se toma toda la cola disponible, hasta un máximo de 32 estados, y se calcula la distancia de cada uno al estado final. El filtro se activa sólo si la distancia máxima de esa cola es menor o igual que 10⁻⁶; se requieren al menos cuatro estados finitos.
- Información insuficiente: quedan menos de 64 estados finitos.
- Periodicidad o baja complejidad: en una ventana de hasta 256 estados, la desviación típica máxima por coordenada es menor que 10⁻⁴.
- Repetición cuantizada: si la ventana contiene más de 16 estados, se redondea a cinco decimales y la razón de estados únicos resulta menor que 0.2.
- Supervivencia: si ninguna regla anterior se activa, se asigna el estado interno
candidate_chaoticpara continuar la revisión numérica.
La estimación rápida del exponente máximo evoluciona dos estados separados inicialmente por ε=10⁻⁷ en la primera coordenada. Cada q=5 pasos mide la distancia d, acumula log(d/ε) y renormaliza la separación:
La búsqueda rápida usa 350 pasos, equivalentes a 70 renormalizaciones. Si la separación cae por debajo de 10⁻³⁰⁰ se informa −∞; si aparece un valor no finito o una norma de 10⁶, la estimación queda no disponible. Las familias especiales siguen sus propios diagnósticos. Un valor positivo corto orienta el siguiente experimento; una afirmación sobre el exponente requiere una estimación convergente.
06
Catálogo clásico Sprott A–S: otra nomenclatura
| Sistema clásico | Ecuaciones |
|---|---|
| Sprott A | |
| Sprott B | |
| Sprott C | |
| Sprott D | |
| Sprott E | |
| Sprott F | |
| Sprott G | |
| Sprott H | |
| Sprott I | |
| Sprott J | |
| Sprott K | |
| Sprott L | |
| Sprott M | |
| Sprott N | |
| Sprott O | |
| Sprott P | |
| Sprott Q | |
| Sprott R | |
| Sprott S |
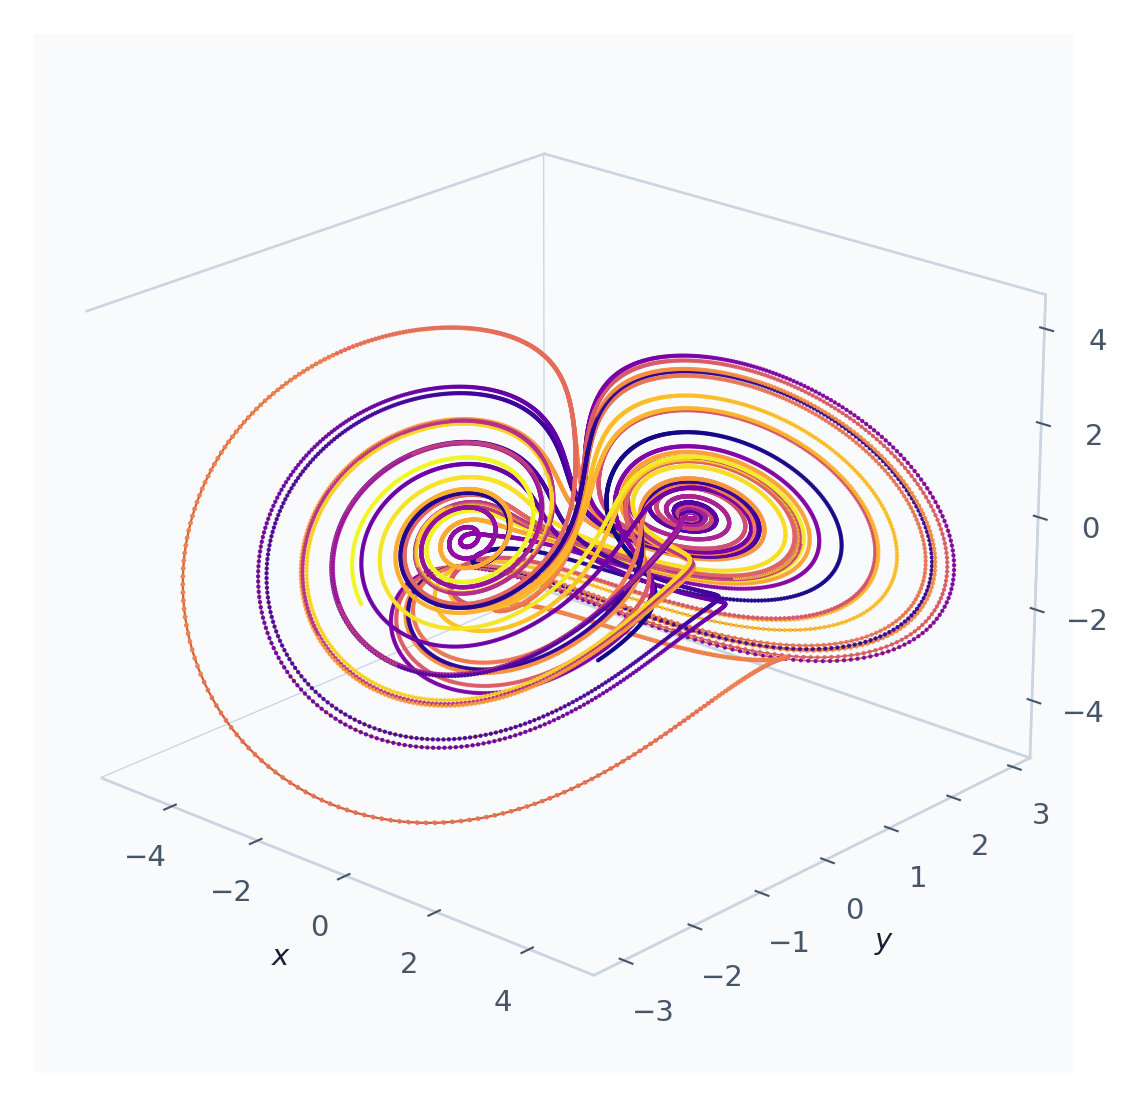
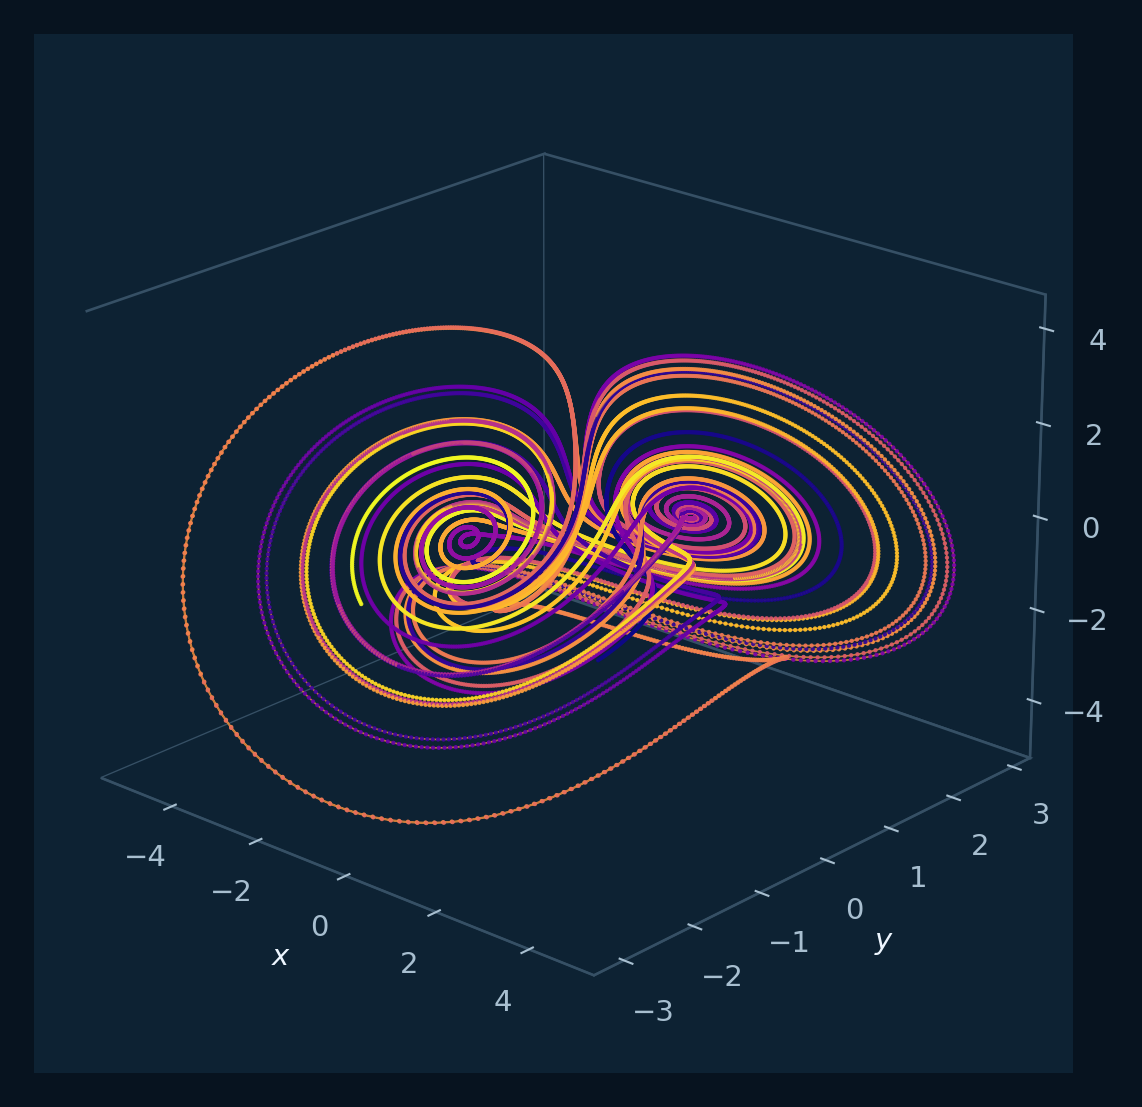
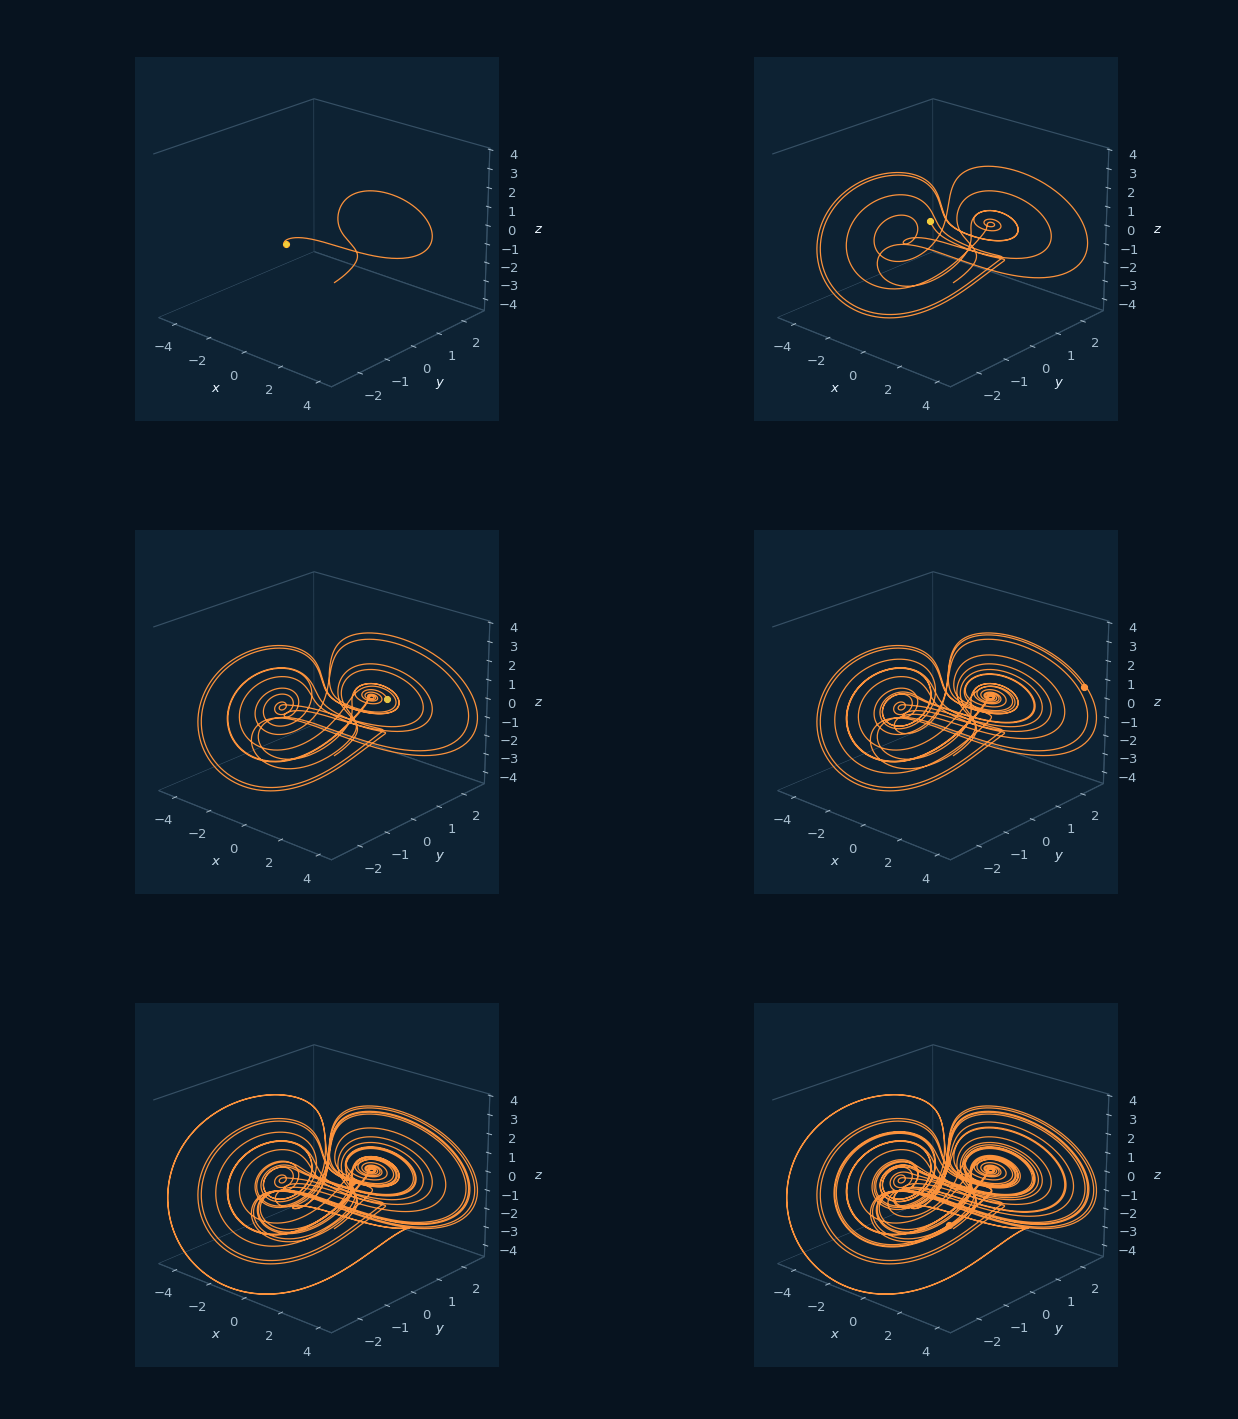
Como ejemplo de la separación, el flujo clásico Sprott B puede representarse en la familia Q —flujo 3D cuadrático— con el código QMMMMMMMMWMMWCMMMMMMMWMMMMCMMMM. La Q inicial describe la gramática; la B sólo es el nombre del sistema de referencia.
07
Ejemplos algebraicos reproducibles
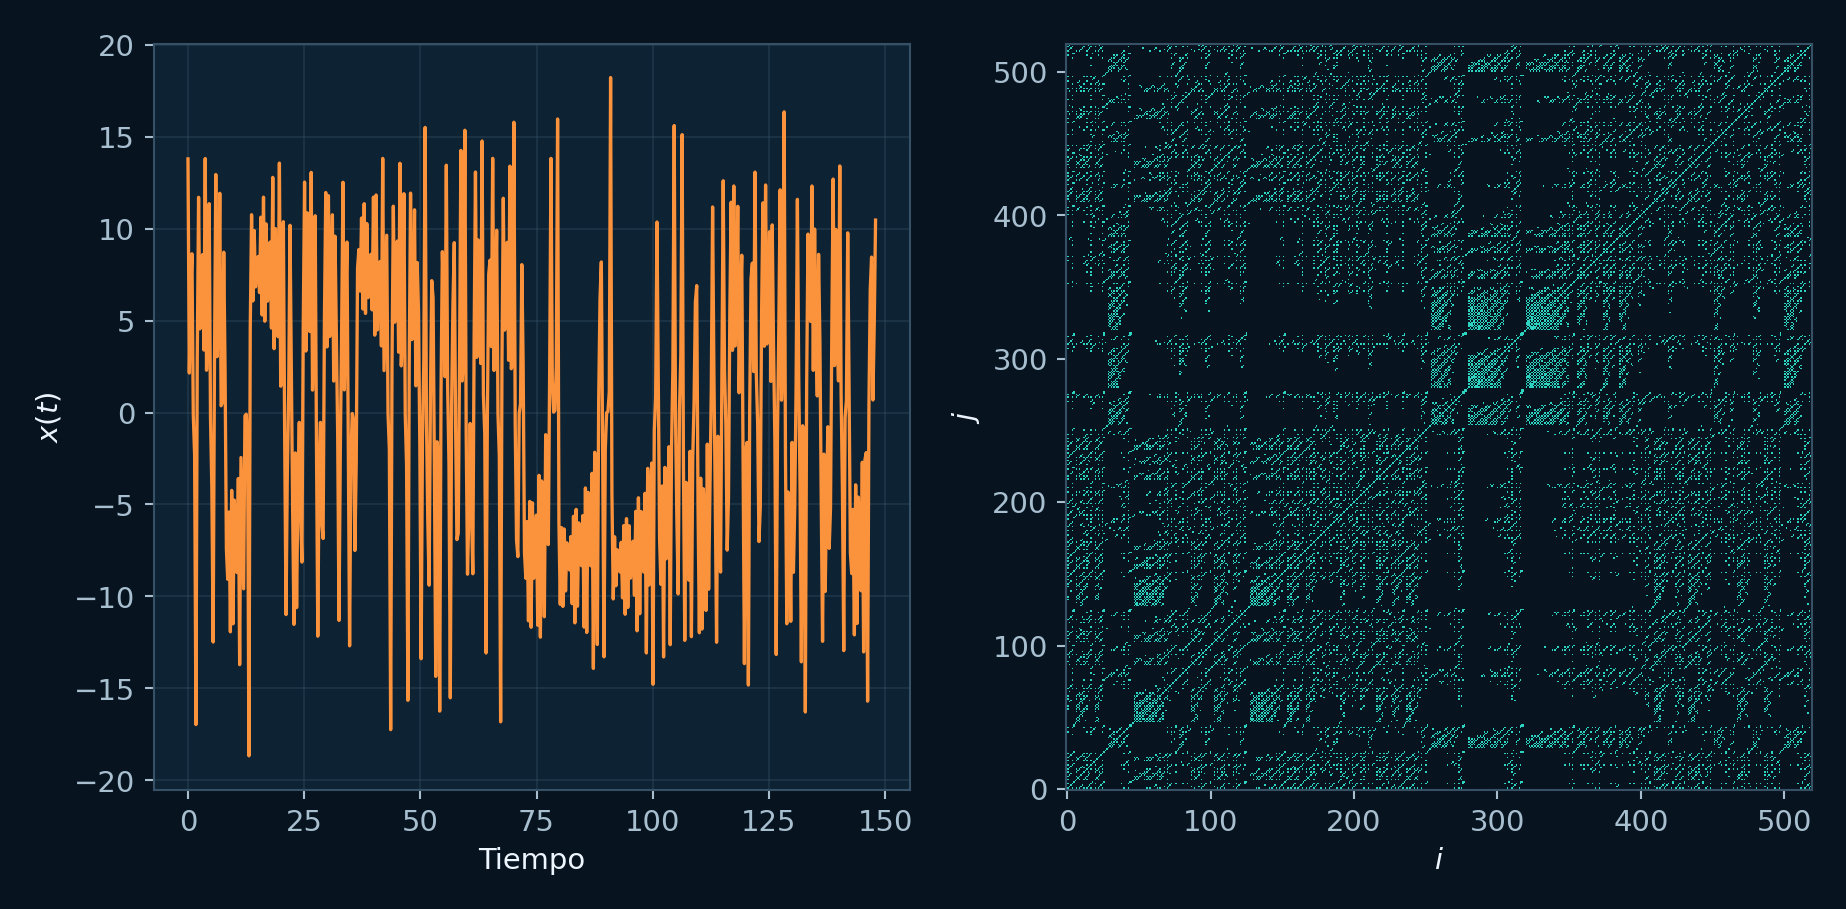
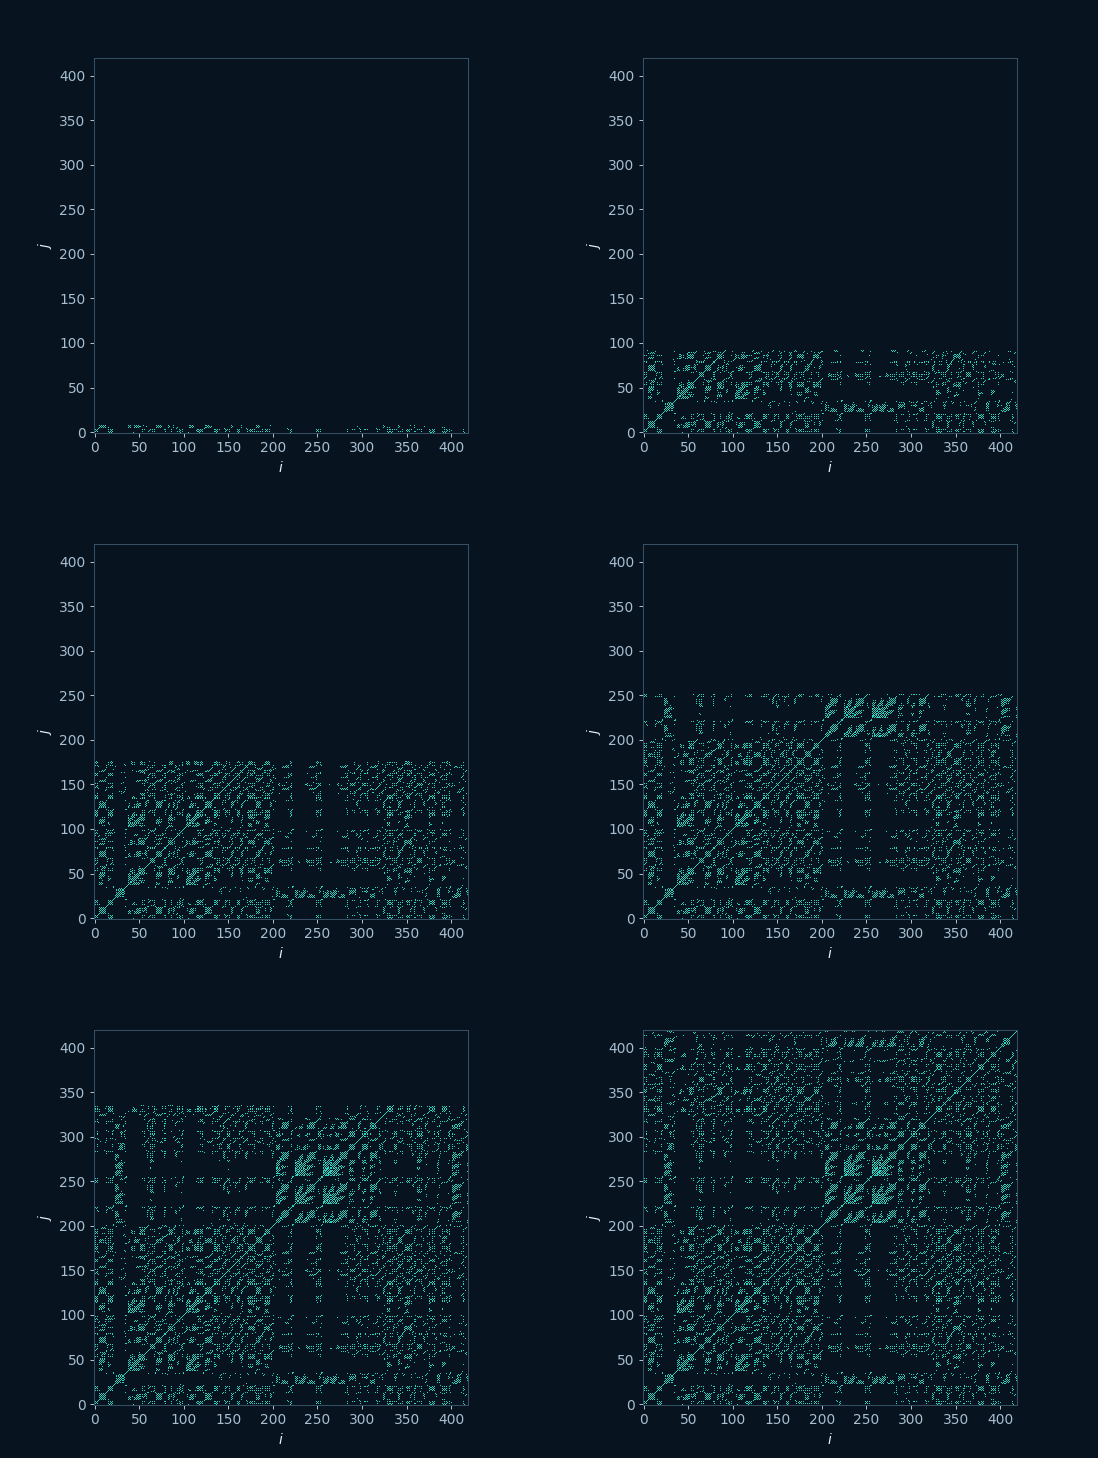
Todos parten de 0.1 en cada coordenada. Ejecute primero los tres códigos 1D: juntos verifican decodificación, punto fijo y divergencia antes de probar estructuras más extensas.
AWMA
Mapa cuadrático 1D
Ajustes: N=1400, transitorio=80, Rdiv=10⁹, vista n–x.
Lectura: El código empieza con la clave de familia A. W=1, M=0 y A=−1.2 ocupan, en ese orden, la base (1,x,x²). La órbita queda acotada y el filtro rápido suele reconocer baja complejidad.
AMMM
Punto fijo inmediato
Ajustes: N=600, transitorio=10, Rdiv=10⁹.
Lectura: Los tres coeficientes son cero. Desde x₀=0.1, la primera iteración llega a cero y todas las siguientes permanecen allí.
AMYM
Divergencia por crecimiento
Ajustes: N=420, transitorio=0, Rdiv=10⁶.
Lectura: Y codifica 1.2 en el término lineal. El umbral se rebasa cerca de n=89, por lo que la ejecución se detiene como divergente.
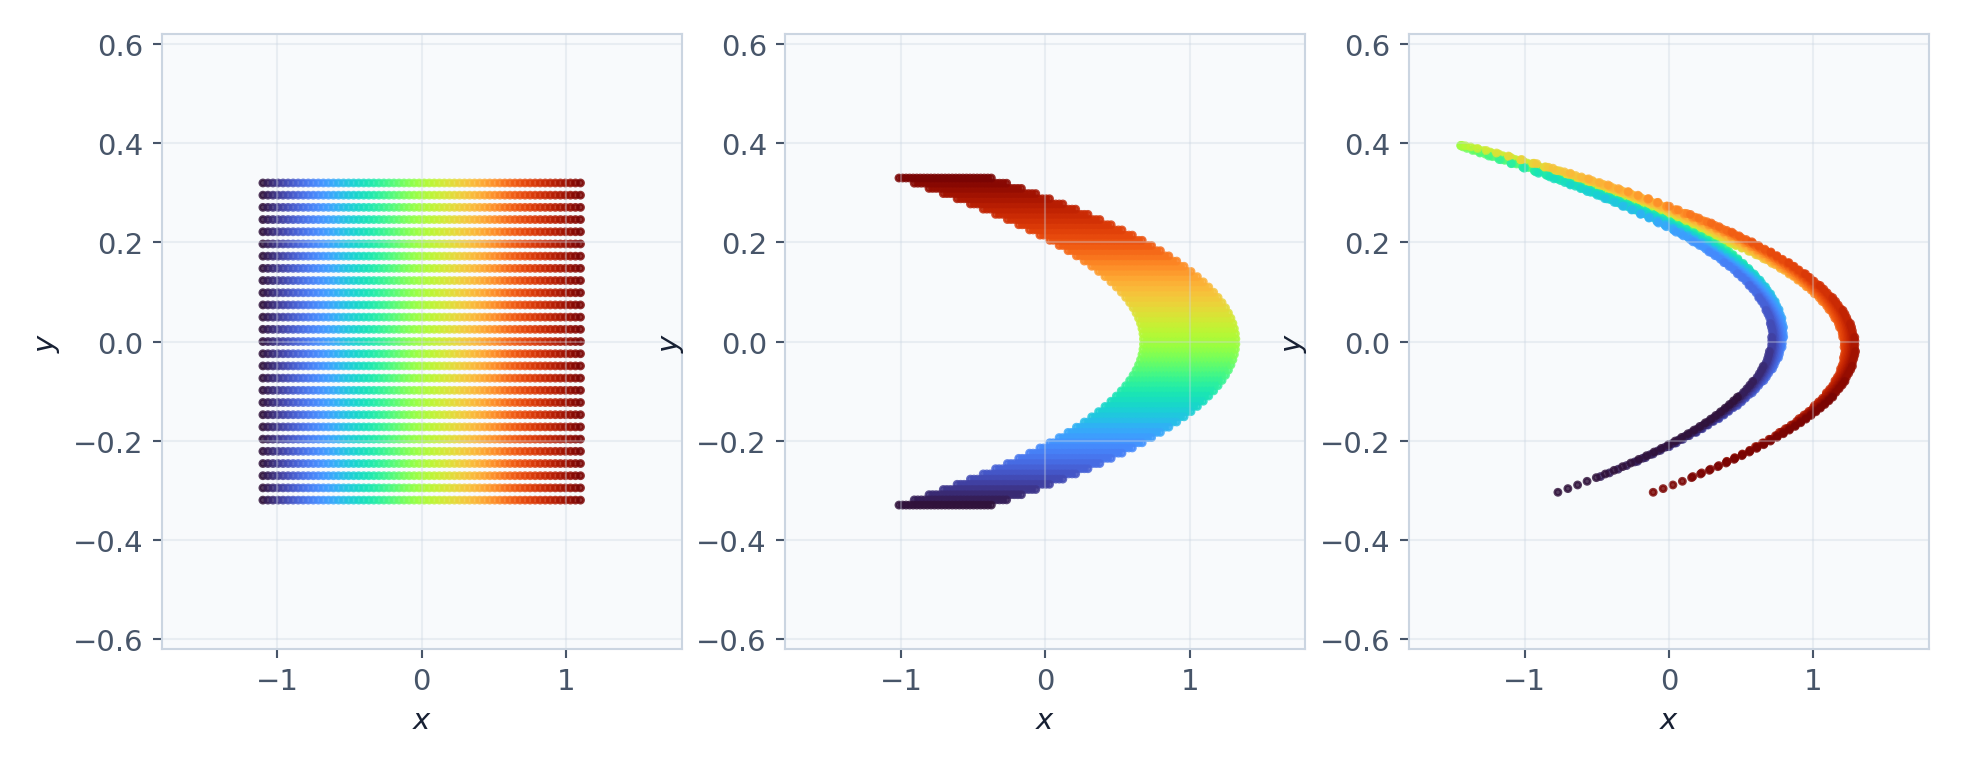
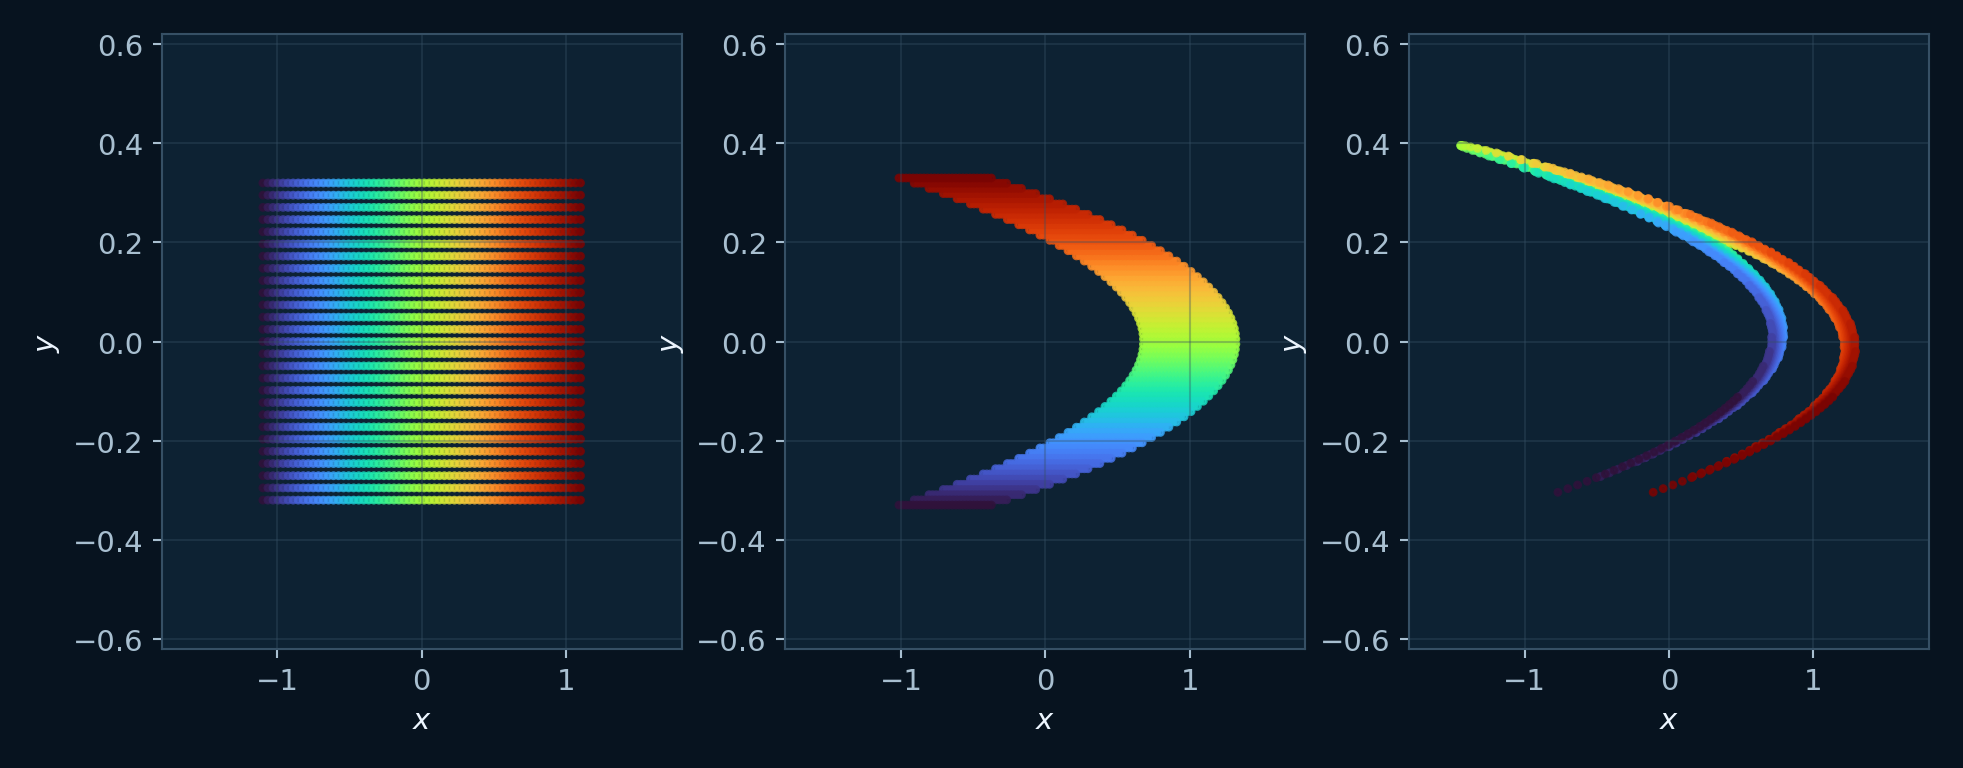
EWMWAMMMPMMMM
Mapa tipo Hénon en gramática E
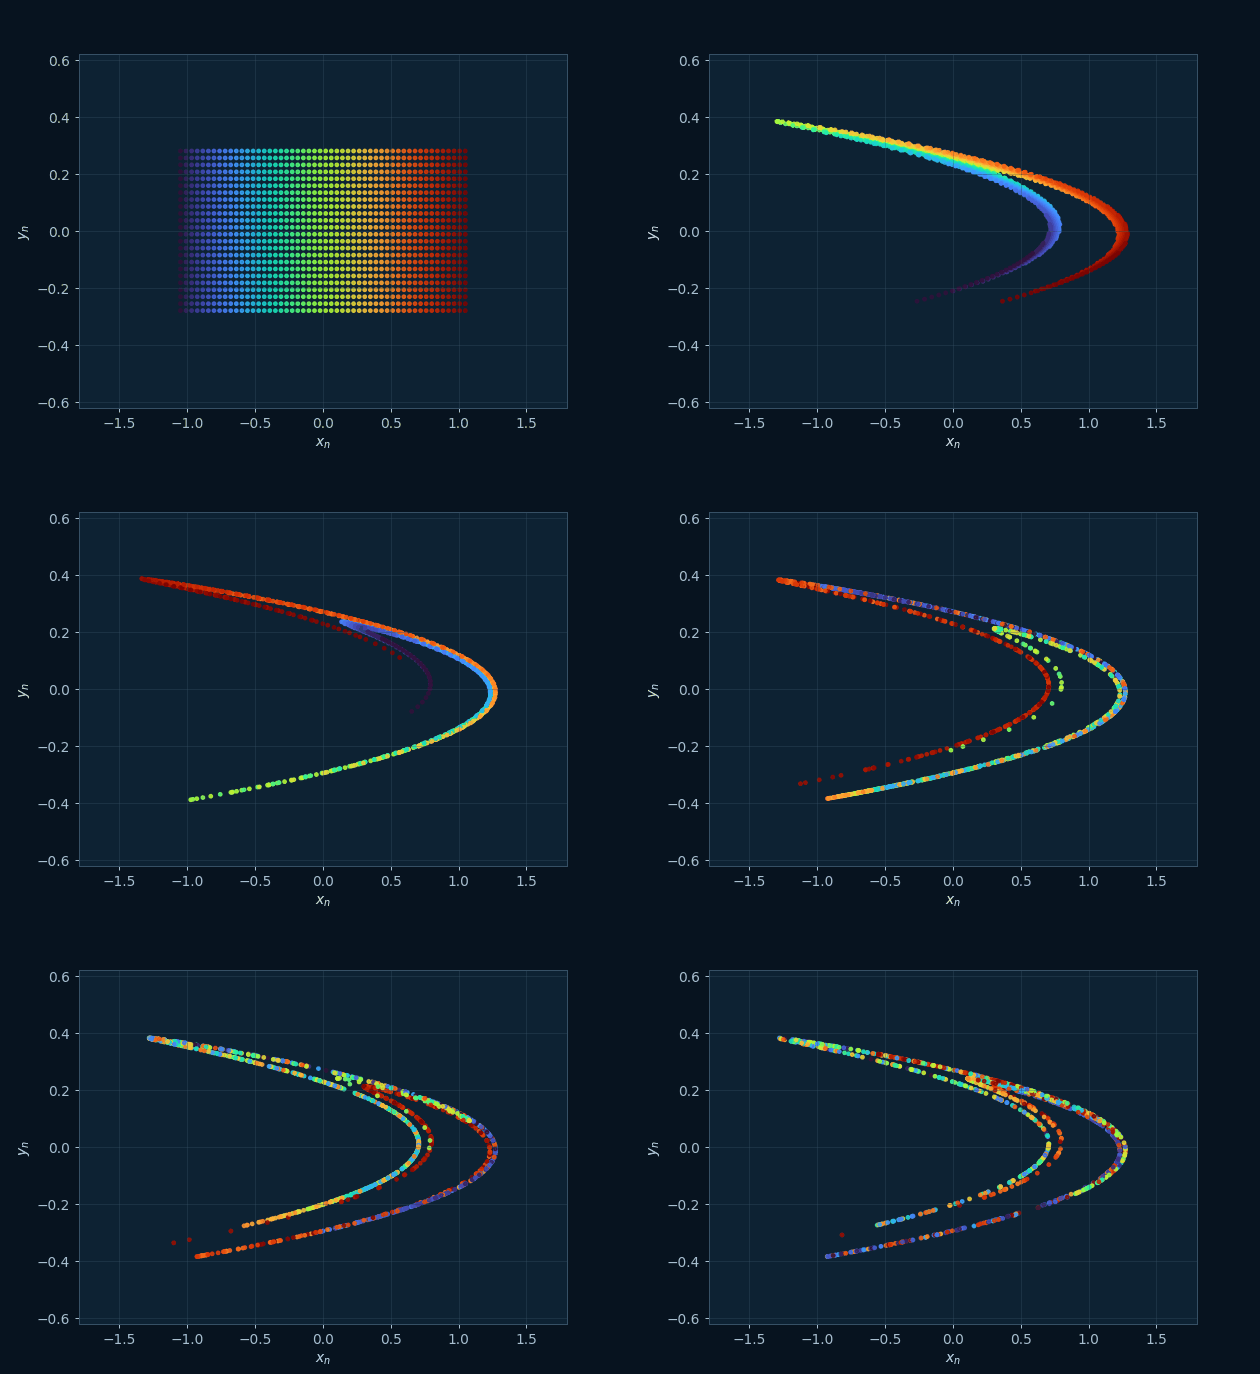
Ajustes: N=28 000, transitorio=1200, Rdiv=10⁹, plano x–y.
Lectura: La clave E indica un mapa 2D cuadrático. El resto del código llena dos filas de seis monomios y define la familia de iteración correspondiente.
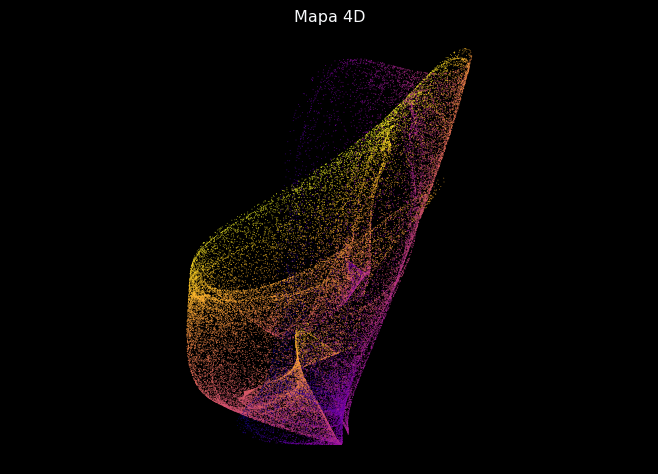
MSLMFPHPIEFTPJJLOJNNTQQIINJUKJUUPPRMFIRIMELNKERJJIGJSGFLLOMSU
Mapa cuadrático 4D
Ajustes: N=52 000, transitorio=2600, Rdiv=10⁹, plano x–y y color por w.
Lectura: La clave M exige 60 coeficientes después del primer símbolo. La proyección muestra dos coordenadas y el color codifica información de la cuarta dentro de esa vista bidimensional.
08
Contrato JSON, CSV y bitácora ampliada
Metadatos JSON actuales
- código, origen y, cuando existe, archivo y línea;
- N, transitorio, h, método y Rdiv;
- proyección, color, paleta y controles de dibujo;
- estado del filtro, notas, fecha y atribución.
Revise los campos incluidos en el archivo y complemente el registro con x0, ecuaciones reconstruidas, backend efectivo, vector temporal, rangos, estado detallado de Lyapunov, semilla y número máximo de intentos cuando el estudio los requiera.
Trayectoria CSV actual
- encabezado
n,x,y,z,wrecortado a la dimensión; - sólo filas finitas posteriores al transitorio;
- 17 cifras significativas;
- n vuelve a empezar en cero como índice local de muestra; t se reconstruye con el paso y el transitorio declarados.
Para un flujo que conserva todas las muestras intermedias, reconstruya el tiempo como y declare esta convención.
Registro que completa el paquete
Agregue versión y plataforma; código exacto; familia, D, O y orden monomial; ecuaciones o matriz C; x0; mapa o flujo; integrador, h, N y T; transitorio en muestras y tiempo; umbral y backend; tolerancias del filtro y parámetros de Lyapunov; semilla, intentos y origen; proyección, color y estilo; prueba de refinamiento; nombres de archivos y hash. De esta forma, la imagen queda unida al experimento que la produjo.
{
  "code": "AWMA",
  "family_key": "A",
  "object_type": "map",
  "dimension": 1,
  "order": 2,
  "x0": [0.1],
  "iterations": 1400,
  "transient": 80,
  "divergence_radius": 1000000000,
  "projection": "n-x",
  "refinement": "repeat with 2800 iterations"
}